


In the forex market analysis, traders can pick between technical analysis (reading charts and indicators) or fundamental analysis (studying economic and geopolitical events). Although some stick to just one, combining both gives you the best of both worlds. Think of it like having a map (fundamentals) and a compass (technical) for your trading journey.
Forex technical analysis is all about understanding price charts, spotting patterns, drawing trendlines, and using indicators to guess where things might head next. On the flip side, fundamental analysis dives into the economic factors that really affect currency values.
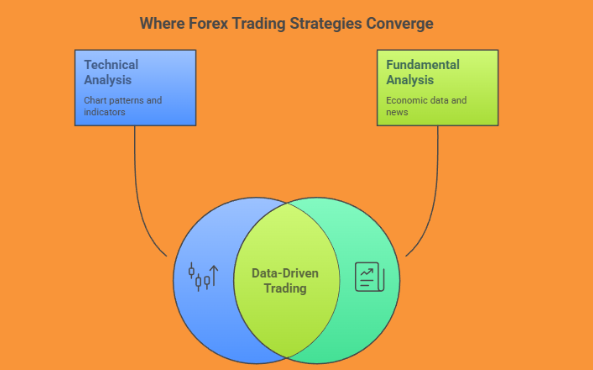
Instead of viewing technical and fundamental strategies as competing philosophies, the most successful traders see them as complementary tools. Hedge-fund titan Paul Tudor Jones, for instance, often uses macroeconomic insights to decide on trade direction and then relies on technical indicators like the 200-day moving average to nail down his entry points.
Technical Analysis Explained
Technical analysis is a visual, data-driven approach to forex market forecasting. It works on the idea that all known info is already factored into the market, so by looking at the price action, traders can make educated guesses about future ones.
Traders use various forex charts for beginners and experts alike, ranging from minute or tick charts for scalping, to hourly and daily charts for day trading, and weekly charts for swing trades. They analyze price action through candlestick patterns like pin bars and dojis, plus formations like head-and-shoulders or triangles that hint at breakouts or reversals.
A powerful example of technical analysis is RSI divergence. In one case, the EUR/USD made a lower low, but the RSI formed a higher low—this “bullish divergence” signaled waning selling pressure and preceded a sharp reversal upward.
Fundamental Analysis Explained
While charts show what is happening in the market, fundamental analysis in forex helps traders understand why it’s happening. Instead of just relying on patterns or indicators, fundamental analysis zooms in on the macroeconomic and geopolitical forces that drive currency value.
Beyond economics, forex news trading must account for geopolitical developments like elections, wars, pandemics, or global trade tensions that shape investor sentiment. Take the 2016 Brexit vote, which caused the GBP/USD to drop to a 30-year low in just a few hours because of a big change in how the economy was viewed. Also, a better-than-expected Non-Farm Payroll (NFP) report usually boosts the U.S. dollar, while a disappointing one can lead to selling.
Comparing Technical vs Fundamental Analysis
A classic example of why this mix is vital: a technical breakout in EUR/USD might look good until a central bank announces a dovish shift, causing the pair to crash. The chart might say “buy,” but the fundamentals scream “be careful.”
The lesson? Don’t just stick to one way of looking at things. The best analysis for forex trading comes from blending both methods.
How to Combine Both Analyses in Practice
Begin by scanning economic calendars and news feeds. Look for big events like interest rate hikes, NFP reports, or comments from central banks. This gives you a big picture view and helps you figure out which currencies are strong or weak (like being bullish on USD if the Fed is aggressive, or bearish on JPY if the BoJ is soft).
Now, check out the charts. Mark support and resistance levels, look for candlestick patterns, and keep an eye on momentum indicators like RSI or MACD. See if the price movement backs up your fundamental view.
Conclusion
In forex trading, you won’t find success by sticking to just one approach. The most effective forex trading strategies come from combining both technical and fundamental analysis.
To really learn forex analysis, practice is crucial. Keep a trading journal to see how economic news and chart signals worked together (or didn’t) in each trade. This habit will help you refine your own style and avoid repeating the same mistakes.
For more info:-
Comments