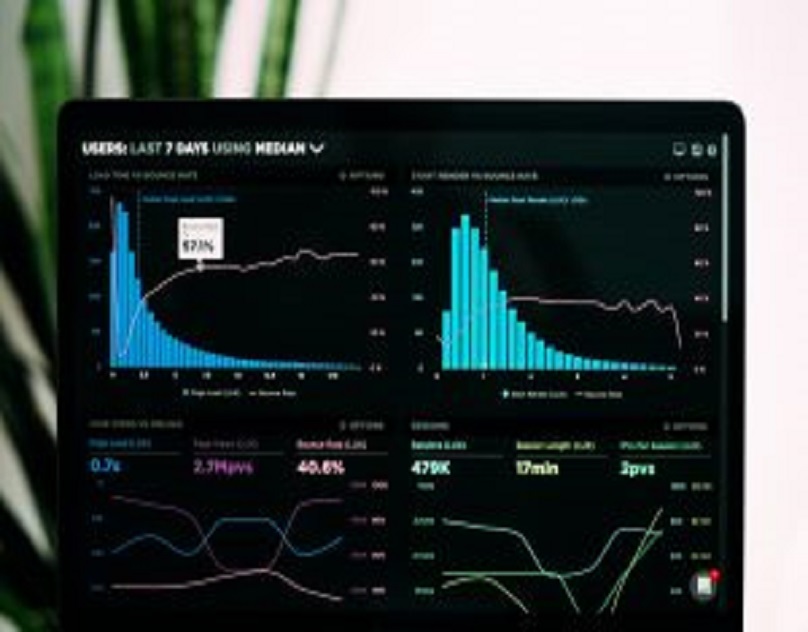
Excel is a powerful tool that can be used to analyze data and create visual representations of information. Dashboards are a popular way to present data in a concise and meaningful way, and with an online course in Excel Dashboard creation, you can learn how to create effective dashboards that can help you communicate data to others.
Excel dashboards are essentially one-page summaries of data, which can include charts, graphs, and tables. These summaries can be used to track key performance indicators, monitor progress, or to provide an overview of a project. An effective dashboard can save time and reduce the complexity of data analysis, making it easier for you to make informed decisions.
The first step in creating an effective dashboard is to gather the data that you want to include. This could be data from an existing spreadsheet, or you may need to collect new data. Once you have your data, you can use Excel to create charts and graphs that represent the information visually.
An online course in Excel Dashboard creation will provide you with the skills and knowledge needed to create effective dashboards that communicate data effectively. The course will typically cover topics such as:
Understanding the principles of data visualization: Understanding how to represent data visually is essential for creating effective dashboards. In this section, you will learn about different chart types, visual design principles, and how to choose the right type of visualization for your data.
Data management in Excel: Managing data in Excel is critical for creating effective dashboards. This section will cover topics such as data validation, cleaning, and transformation.
Creating charts and graphs: In this section, you will learn how to create different types of charts and graphs in Excel. You will also learn how to customize the appearance of charts to make them more effective.
Building a dashboard: In this section, you will learn how to put together all the elements of a dashboard. You will learn how to arrange charts and graphs, how to add interactivity, and how to create summary tables.
Sharing and collaborating: Finally, you will learn how to share and collaborate on your dashboard with others. This section will cover topics such as sharing dashboards with others, using Excel Online, and working with Excel files in OneDrive.
An online course in Excel Dashboard creation can be an excellent way to improve your data analysis skills and create effective dashboards that communicate data in a meaningful way. With the right course, you can learn how to use Excel to create professional-looking dashboards that can help you make informed decisions and communicate your findings to others.
For More Info:-
Excel Courses Online Southern Africa


Comments