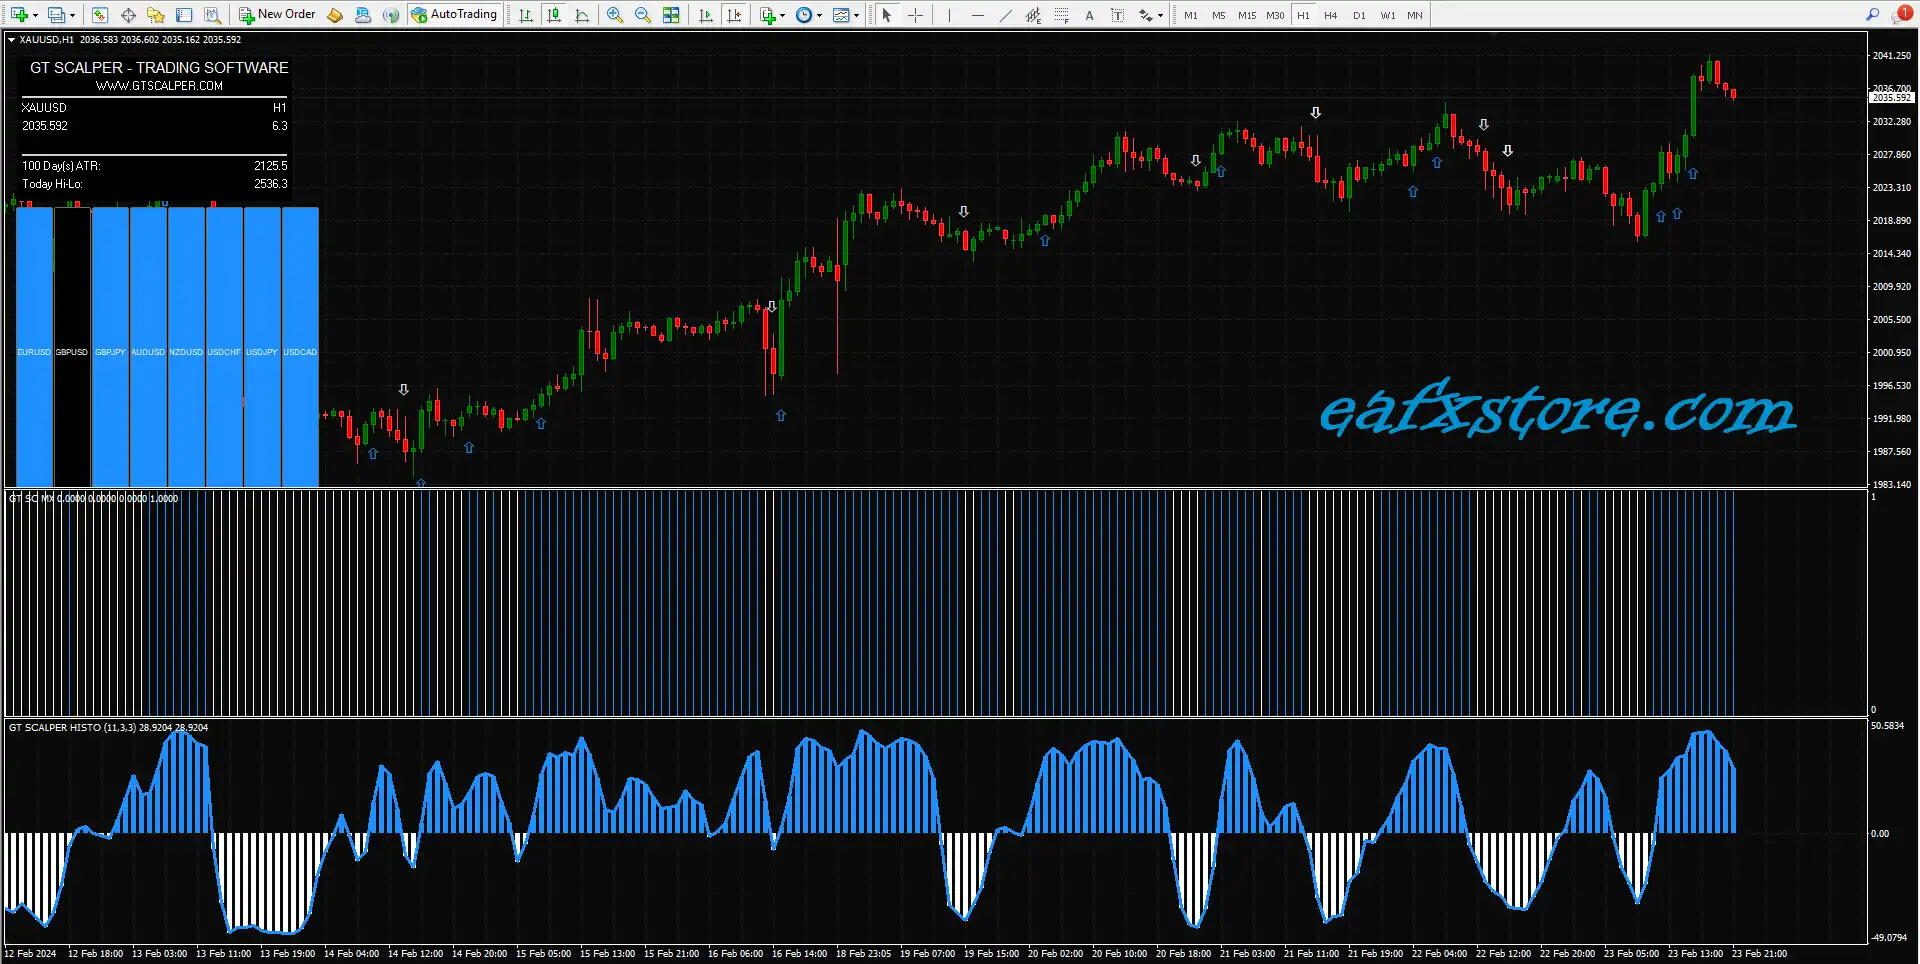
In the world of foreign exchange trading, identifying the direction of a trend is crucial for making informed trading decisions. Forex trend indicators are tools that help traders determine whether a currency pair is trending upward, downward, or moving sideways. These indicators are fundamental for devising strategies and executing trades effectively. Let’s explore some of the most commonly used Forex trend indicators and how they can enhance your trading performance.
Moving Averages
Moving averages are among the most popular trend indicators. They smooth out price data to help identify the direction of the trend. The Simple Moving Average (SMA) calculates the average price over a specific number of periods, while the Exponential Moving Average (EMA) gives more weight to recent prices. By comparing different moving averages, such as the 50-period and 200-period, traders can identify potential buy or sell signals. When a shorter-term moving average crosses above a longer-term one, it may indicate an uptrend, while the opposite crossover could signal a downtrend.
Average True Range (ATR)
The Average True Range (ATR) measures market volatility rather than direction. However, understanding volatility is crucial for trend analysis. A higher ATR indicates increased volatility, which often accompanies strong trends. Traders use ATR to set stop-loss orders and to gauge the potential range of price movements. A rising ATR suggests that a trend may be gaining strength, whereas a declining ATR could indicate a potential reversal or weakening trend.
Moving Average Convergence Divergence (MACD)
The Moving Average Convergence Divergence (MACD) is a versatile indicator that combines moving averages with momentum analysis. It consists of two lines: the MACD line and the signal line. When the MACD line crosses above the signal line, it generates a bullish signal, suggesting the potential for an upward trend. Conversely, when the MACD line crosses below the signal line, it could indicate a bearish trend. The MACD also includes a histogram that represents the difference between the MACD and signal lines, providing additional insight into trend strength.
Bollinger Bands
Bollinger Bands consist of a middle band (SMA) and two outer bands that represent standard deviations from the SMA. The bands expand and contract based on market volatility. When the bands widen, it indicates increased volatility and potential trend strength. Conversely, when the bands contract, it suggests lower volatility and a potential trend reversal or consolidation. Traders use Bollinger Bands to identify potential entry and exit points based on price touching or breaching the bands.
Ichimoku Cloud
The Ichimoku Cloud is a comprehensive indicator that provides information on support and resistance levels, Forex Trading Robot, and momentum. It consists of five lines: Tenkan-sen, Kijun-sen, Senkou Span A, Senkou Span B, and Chikou Span. The area between Senkou Span A and Senkou Span B forms the “cloud.” Price above the cloud indicates an uptrend, while price below the cloud suggests a downtrend. The cloud’s thickness can also provide insights into the strength of the trend.
Parabolic SAR
The Parabolic SAR (Stop and Reverse) is a trend-following indicator that provides potential entry and exit points. It appears as dots on the chart, with dots below the price indicating an uptrend and dots above the price signaling a downtrend. The indicator helps traders set trailing stop-loss orders and recognize potential trend reversals.


Comments