


Understanding the Average Directional Index (ADX) Indicator: A Beginner’s Guide
Introduction
Have you ever wondered how traders know when a market is trending or just moving sideways? It’s not magic—it’s indicators! And one of the most powerful tools in any trader’s toolbox is the Average Directional Index (ADX). Whether you're enrolled in equity trading courses or simply curious about technical analysis, this guide is designed just for you.
In simple terms, ADX helps you figure out the strength of a trend—whether it’s going up or down or just not moving at all. Think of it like a weather forecast for the stock market: it doesn’t tell you if it’s sunny or rainy (bullish or bearish), but it does tell you whether to expect a strong storm or a gentle breeze.
Discover how the Average Directional Index works in this easy guide. Great for beginners in equity trading courses or a technical analysis course.
What Is the Average Directional Index (ADX)?
The Average Directional Index or ADX is a technical analysis indicator used to determine the strength of a trend—not the direction, just the strength. It’s like a volume knob on your favorite playlist: it doesn't change the song (direction), but it lets you know how loud the beat is (trend strength).
A Brief History of the ADX Indicator
The ADX was developed by J. Welles Wilder in 1978, a name you’ll hear often if you dive into any technical analysis course. Wilder introduced it in his book "New Concepts in Technical Trading Systems", and since then, it's become a go-to for traders across the globe.
How Does the ADX Work?
ADX is derived from two other indicators: the Positive Directional Indicator (+DI) and the Negative Directional Indicator (-DI). Together, they help traders determine whether bulls (buyers) or bears (sellers) are in control—and how strong that control is.
Here’s the cool part: the ADX is the smoothed average of the difference between +DI and -DI over a set period (usually 14 days).
The ADX Scale: What the Numbers Really Mean
The ADX ranges from 0 to 100, and each number tells a different story:
- 0–20: Weak trend or no trend
- 20–40: Moderate trend strength
- 40–60: Strong trend
- 60–100: Very strong trend
So, if the ADX is under 20? The market’s napping. Over 40? It’s wide awake and on the move!
The Three Musketeers: ADX, +DI, and -DI
These three indicators work together like the three musketeers:
- +DI (Positive Directional Indicator): Measures upward movement
- -DI (Negative Directional Indicator): Measures downward movement
- ADX: Measures trend strength, regardless of direction
When +DI is above -DI, the trend is likely up. When -DI is above +DI, the trend is likely down.
How to Read and Interpret ADX Values
Let’s say you see an ADX of 45. That’s a strong trend. If +DI is higher than -DI, it means a strong uptrend. If it’s the other way around, you’re likely in a strong downtrend.
A rising ADX means the trend is strengthening. A falling ADX? The trend is weakening—time to tread carefully.
Why ADX Matters in Equity Trading Courses
If you’re learning through equity trading courses, you’ll notice how often instructors emphasize knowing when to trade. ADX is perfect for this. It tells you when the market is ripe for action or when to sit back and relax.
Trading without understanding the trend strength is like fishing without checking the tide—you might still catch something, but it’s a lot harder.
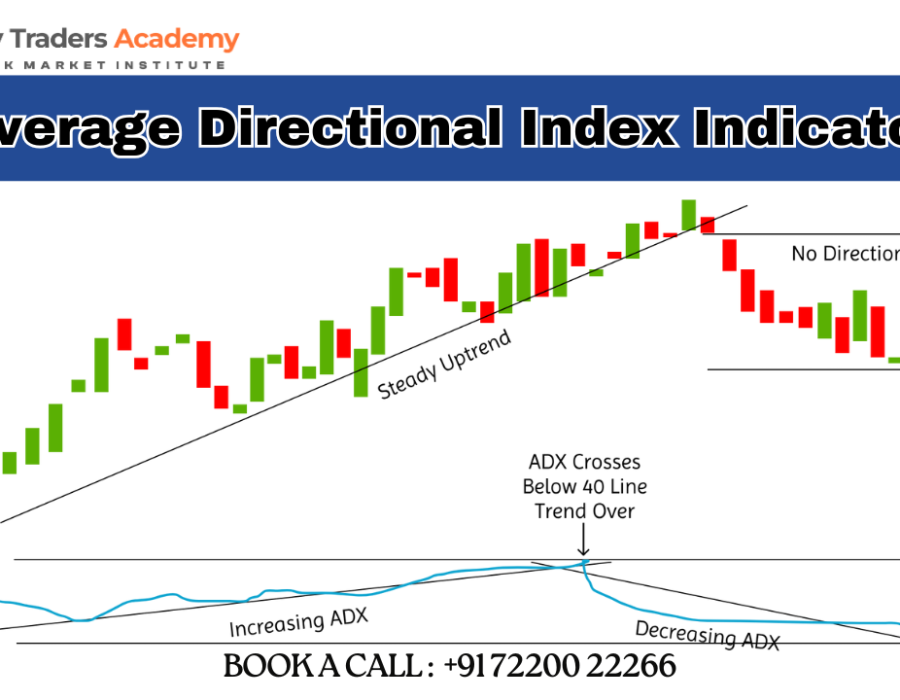
ADX in Action: Spotting Trends Like a Pro
Imagine you’re watching a stock that’s been climbing steadily. The ADX climbs past 25—ding ding ding! That’s your sign that the trend is gaining strength.
Now, compare that to a chart where prices are moving sideways, and the ADX is sitting below 20. That's not the time to jump in. Think of ADX as your trend confirmation buddy.
Common Mistakes When Using ADX
Even the best tools can be misused. Here are common blunders:
- Ignoring Direction: Remember, ADX doesn’t tell you which way the market’s going—just how strong the move is.
- Over-relying on ADX alone: Combine it with other tools like moving averages or RSI.
- Forcing trades in low-ADX markets: Low ADX means low momentum. Don’t fight the flow!
ADX vs. Other Technical Indicators
How does ADX compare to other indicators like MACD or RSI?
- RSI (Relative Strength Index) tells you if a stock is overbought or oversold.
- MACD (Moving Average Convergence Divergence) gives you trend direction and momentum.
- ADX, however, focuses purely on trend strength.
It’s like asking for a weather report—MACD and RSI give you the forecast, ADX tells you how windy it’s going to get.
Using ADX with Moving Averages
ADX becomes even more powerful when paired with moving averages.
Let’s say a stock crosses above its 50-day moving average and ADX is above 25. That’s a confirmation that the trend is real and may continue.
You get direction from the moving average and strength from ADX. Dynamic duo!
Setting Up ADX in Trading Platforms
Most modern trading platforms include ADX by default. Here’s how you do it:
- Open your chart.
- Select “Indicators.”
- Search for “ADX.”
- Apply it with a 14-period setting (standard).
- Add +DI and -DI if not shown automatically.
Done! You’re now officially geared up.
Real-Life Examples: Charts Don’t Lie
Let’s take Apple stock as an example.
- In July, ADX moved from 18 to 30 while the price steadily climbed. Trend confirmed!
- In August, the ADX dropped back below 20. Trend weakened, time to stay cautious.
These insights make ADX a trader’s best friend, especially when combined with lessons from a solid technical analysis course.
Tips to Maximize Your Use of ADX
- Combine it with trend indicators. Use moving averages or trendlines for added confidence.
- Avoid using it in isolation. Add volume indicators or candlestick patterns.
- Stick to the timeframe you trade in. Short-term trades? Use shorter ADX settings like 7 or 10.
Is ADX Right for You?
If you’re looking to avoid trading blind, the ADX might be just what you need. Whether you're a beginner or brushing up your skills through equity trading courses, it adds an extra layer of clarity that can protect your capital and improve your timing.
Conclusion
The Average Directional Index is one of those indicators that doesn't try to predict the future. Instead, it helps you respond better to what’s already happening in the market. Like a compass, it won’t tell you where to go, but it’ll tell you how strong the wind is blowing in that direction.
So whether you’re deep into a technical analysis course or just starting out in the trading world, keep ADX on your radar. It could be the difference between chasing shadows and following real trends.
FAQs
What does an ADX value below 20 mean?
An ADX below 20 usually signals a weak trend or sideways movement—basically, not a good time for trend-based trades.
Can ADX predict market direction?
No, ADX only measures the strength of a trend, not whether it's going up or down. You'll need to look at +DI and -DI for direction.
Is ADX suitable for beginners?
Absolutely! It’s easy to learn and very useful, especially when combined with what you learn in equity trading courses.
What’s the best time frame to use ADX?
The 14-period ADX is the standard, but you can adjust it based on your trading style—shorter for quick trades, longer for long-term investing.
Can I use ADX for all asset classes?
Yes! ADX works for stocks, forex, crypto, commodities—you name it. It's versatile and widely used in all financial markets.
Comments