


In today's digital age, businesses generate more data than ever before. From customer interactions and online transactions to product performance and employee productivity, data comes from nearly every aspect of an organization. But with the exponential growth in data comes the challenge of effectively analyzing and presenting it. Raw data is often overwhelming, complex, and difficult to make sense of. This is where data visualization software plays a crucial role.
What is Data Visualization Software?
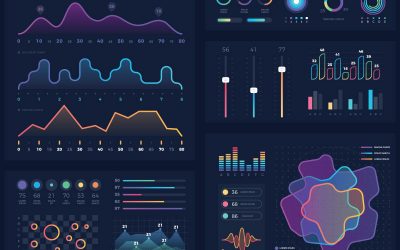
At its core, data visualization software is a tool designed to represent data graphically. The purpose of this software is to make data more accessible, easier to interpret, and visually compelling. Through interactive dashboards, heat maps, pie charts, scatter plots, and bar graphs, users can make sense of complex information, allowing for better decision-making.
When you have access to data presented visually, it's easier to identify trends, patterns, correlations, and anomalies. This allows both technical and non-technical users to interpret data, from C-suite executives to entry-level employees.

The Importance of Data Visualization in the Modern Business Landscape
In the modern business environment, data is everywhere. Customer behavior, sales patterns, marketing metrics, inventory levels, and much more are all stored in databases or analytics platforms. However, even though data holds immense value, businesses often struggle to leverage it because it’s not presented in a digestible format.
Traditional reports, which often rely on raw tables and spreadsheets, are not the most effective way to communicate critical information. They require time and effort to sift through and are prone to human error.
Data visualization software changes all of this by offering dynamic visuals that can instantly capture insights. This makes it a game-changer for businesses of all sizes. Whether you're a startup looking to scale or an enterprise aiming to optimize performance, the ability to turn raw data into actionable insights gives you a significant edge over competitors.
Benefits of Data Visualization Software for Businesses (In Short)
Improved Data Comprehension
Data visualization simplifies complex datasets, making it easy for stakeholders to identify trends and patterns quickly through visual formats like charts and graphs.
Faster Decision-Making
With real-time data analysis and intuitive dashboards, businesses can make faster, more informed decisions, gaining a competitive edge in a fast-paced market.
Improved Storytelling and Communication
Visual storytelling allows business leaders to communicate insights effectively to both technical and non-technical audiences, fostering better understanding and transparency.
Enhanced Performance Tracking and Monitoring
Customizable dashboards allow businesses to track KPIs in real-time, helping identify issues early and take proactive actions to meet goals.
Improved Data Collaboration
Data visualization facilitates collaboration across teams by providing shared, visual representations of data, making it easier to interpret and align on strategies.
Increased User Engagement
Interactive visuals engage users more than static reports, allowing them to explore data, zoom in on trends, and filter insights, leading to more dynamic interactions with the data.
Key Features to Look for in Data Visualization Software
When selecting the right data visualization software for your business, it’s important to consider the following features:
Ease of Use and User Interface
Choose a tool that has an intuitive and user-friendly interface. It’s essential that both technical and non-technical users can create and interpret data visualizations with minimal training. The simpler and more streamlined the tool, the faster your team can get up and running.
Customization and Flexibility
Every business has unique needs, and data visualization software should be flexible enough to accommodate them. Look for software that offers customization options, including the ability to design dashboards and visuals tailored to your business’s specific requirements.
Customization also includes the ability to adjust how data is displayed, such as choosing the type of charts, color schemes, and layout designs that best represent your data.
Real-Time Data Integration
Real-time data integration is a must-have for businesses that require up-to-the-minute insights. Your chosen software should allow you to connect to various data sources, such as CRM platforms, marketing tools, and enterprise resource planning (ERP) systems, to pull in live data for analysis. This ensures that your visualizations are always up-to-date and accurate.
Advanced Analytics Capabilities
In addition to basic data visualization features, some tools also offer advanced analytics capabilities. Features like predictive analytics, machine learning, and AI-powered insights can help businesses gain deeper insights from their data. These tools analyze historical trends and predict future outcomes, providing businesses with a more proactive approach to decision-making.
Collaboration Tools
Collaboration is critical, especially for large teams spread across different locations. Look for tools that allow for easy sharing and collaboration. Features like shared dashboards, annotations, and multi-user access ensure that your team can collaborate effectively and make data-driven decisions together.
Scalability
As your business grows, so will your data needs. It’s important to choose a tool that can scale with your business. Whether you're adding more users, integrating additional data sources, or increasing the complexity of your visualizations, ensure the software you choose can grow alongside your organization.
How to Use Data Visualization Software to Make Better Business Decisions
Once you have your data visualization software in place, here’s how you can use it to make more informed business decisions:
Track KPIs and Metrics
Set up dashboards that track your most important business metrics. Regularly review these dashboards to identify areas of success and areas that need improvement.
Identify Trends and Patterns
Use the visualizations to identify emerging trends in your business. Whether it’s sales growth or customer churn, visualizations can help you identify these trends early so you can take corrective actions.
Monitor Customer Behavior
Data visualization can help you understand how customers interact with your website or products. By analyzing customer behavior, you can optimize your offerings to improve user experience and increase conversions.
Forecast Future Outcomes
Use predictive analytics and forecasting tools to predict future trends based on historical data. This can help you plan for growth, optimize resources, and avoid potential pitfalls.
Conclusion
In a world where data is constantly being generated, leveraging data visualization software is essential to staying competitive. By turning complex data into easy-to-understand visuals, businesses can unlock actionable insights, improve decision-making, and drive growth.
Contact Us Today!
Are you ready to unlock the power of data visualization and take your business to the next level? Contact us today to learn more about the best data visualization tools for your needs. Let’s turn your data into your greatest asset!
Comments